In this we’ll explain the ICT Advance Market Structure focusing on Short Term High (STH), Intermediate Term High (ITH), and Long Term High (LTH). By the end, you’ll be able to understand and identify market structures with ease.
Download the ICT Advance Market Structure – STH, ITH & LTH PDF!
You can download my ICT Advance Market Structure – STH, ITH & LTH PDF for free at fxmarkethours.com.
What is Market Structure?
Market structure is the way a market behaves at any moment. It helps you see how prices move by showing the market’s ups and downs. This makes it easier to understand the overall direction of the market.
Types of Market Structure
- Bullish Market Structure:
Prices are going up, shown by higher highs and higher lows on the chart. - Bearish Market Structure:
Prices are going down, shown by lower lows and lower highs on the chart. - Sideways Market Structure:
Prices are staying within a range, making equal highs and equal lows.
Understanding ICT Advance Market Structure – STH, ITH & LTH
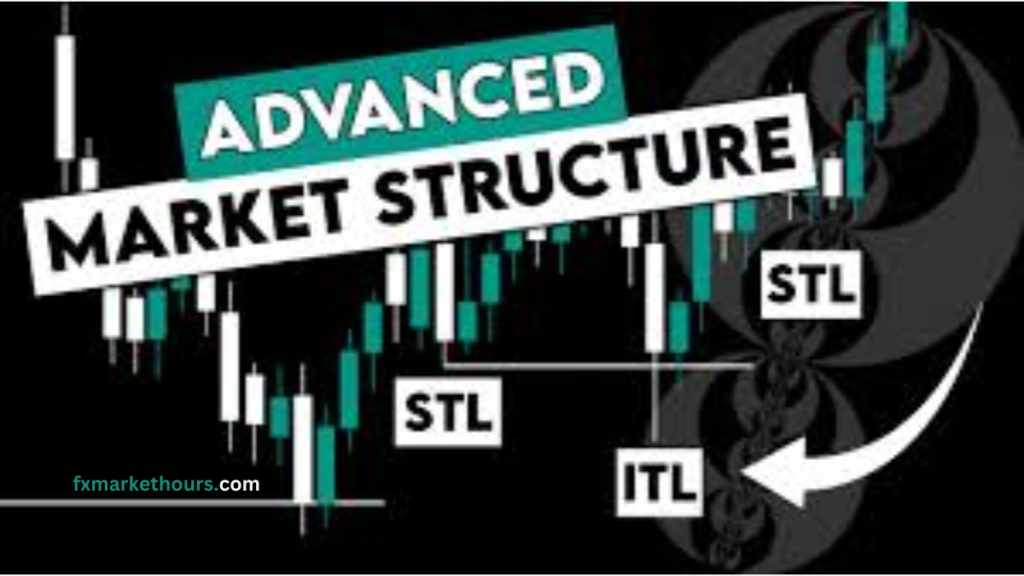
1. Short Term High (STH):
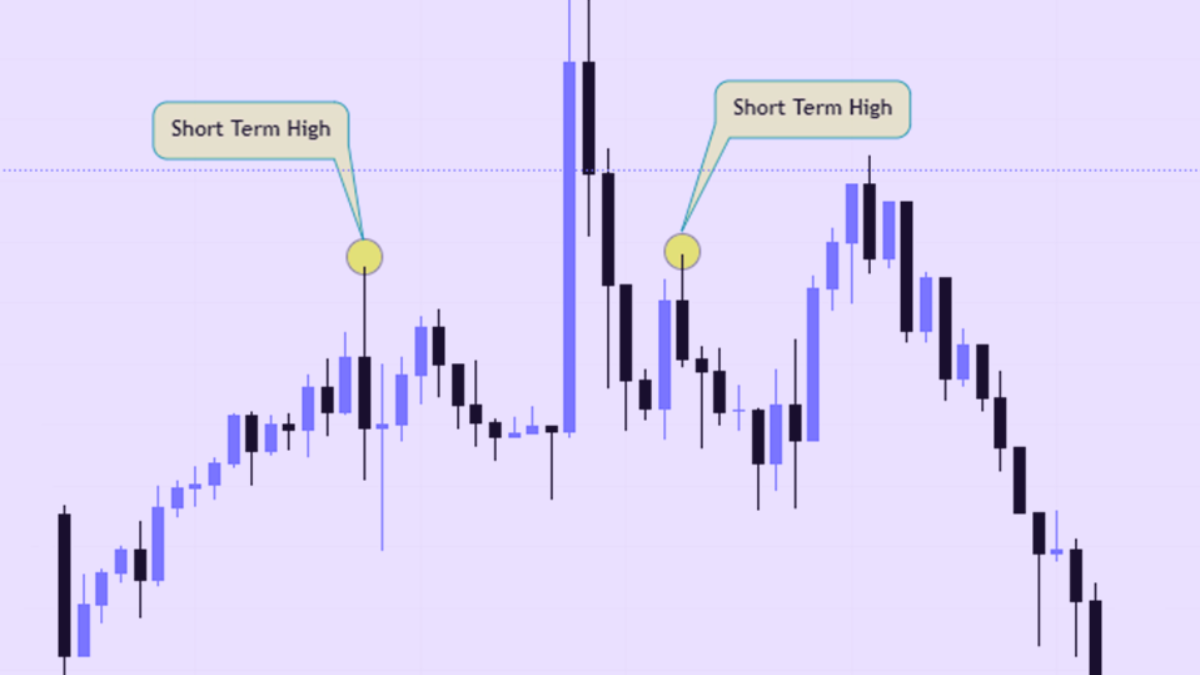
A Short Term High (STH) in ICT is when the middle candle of three has a higher top (or wick) than the candles on both sides. This middle candle’s top is the Short Term High.
2. Intermediate Term High (ITH):
An Intermediate Term High (ITH) is a Short Term High that sits higher than the Short Term Highs on its left and right sides.
3. Long Term High (LTH):
A Long Term High (LTH) is an Intermediate Term High that forms on a larger time frame, usually after the price reacts to a significant level. It’s the highest Intermediate Term High, with lower Intermediate Term Highs on both sides.
In a bullish market, prices will keep making higher Long Term Highs and higher Long Term Lows. If the price drops below the most recent Long Term Low, the bullish trend might end.
