The Volatility 75 Index (also known as VIX 75) has garnered significant attention from traders due to its extreme volatility and profit potential. It represents the volatility of the S&P 500 but is not directly tied to any real-world economic events.
VIX 75 allows traders to capitalize on price movements within a highly volatile market, making it a favorite among experienced traders. This guide will help you understand what the Volatility 75 Index is, how to develop a trading strategy for it, and the best times to trade this unique index.
What Is the Volatility 75 Index?
The Volatility 75 Index is a synthetic index that simulates the volatility levels of the stock market. It is a measure of market sentiment and investor expectations for future market fluctuations.
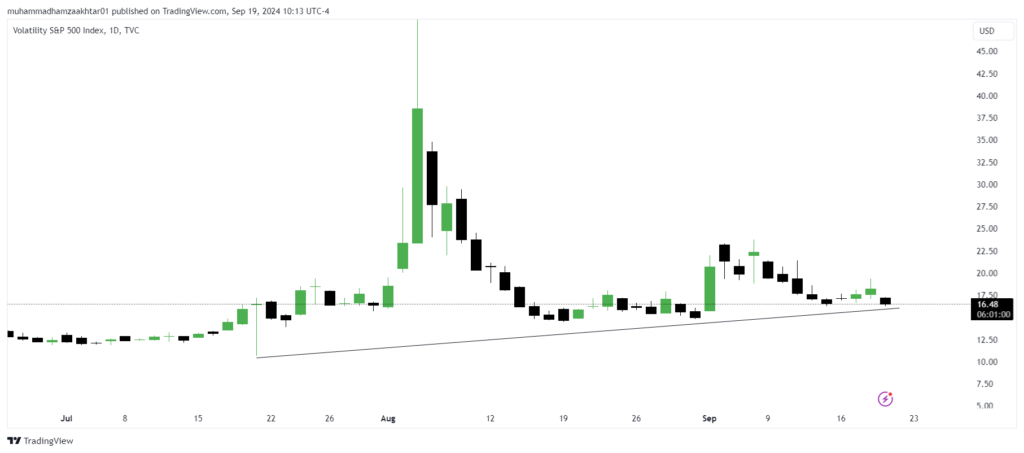
Unlike traditional indices like the Dow Jones or S&P 500, the Volatility 75 Index is unaffected by real-world news or economic conditions. Instead, it behaves according to predefined volatility patterns, providing traders with consistent opportunities to trade around the clock.
Some key characteristics include:
- High Volatility: The VIX 75 offers extreme price fluctuations, which makes it an attractive instrument for traders who seek high-risk, high-reward opportunities.
- Synthetic Nature: Being a synthetic index, it operates based on mathematical models rather than market fundamentals. This offers the advantage of 24/7 availability.
By understanding its movement, traders can make informed decisions, balancing risk and reward effectively.
How to Trade the Volatility 75 Index?
Trading the Volatility 75 Index requires a strategic approach due to its unpredictable price swings. Below are some key strategies that you can employ:
Trend Following:
This is one of the most effective strategies for trading VIX 75. Due to the index’s high volatility, strong trends often emerge, and capitalizing on these trends can lead to substantial profits. By identifying market direction early, traders can ride the trend until a reversal occurs. Steps:
When trading the Volatility 75 Index (VIX 75), using Moving Averages (MA) can help you identify and ride trends in this highly volatile market. Two popular moving averages used in trading are the 50-period Moving Average (short-term) and the 200-period Moving Average (long-term).
Golden Cross in Volatility 75 Trading
The Golden Cross occurs when the short-term moving average (like the 50-period MA) crosses above the long-term moving average (like the 200-period MA). This is often seen as a bullish signal, indicating that the market may be shifting into an uptrend. For the VIX 75 Index, this can signal the potential for a sustained upward price movement, making it a favorable time to enter long trades.
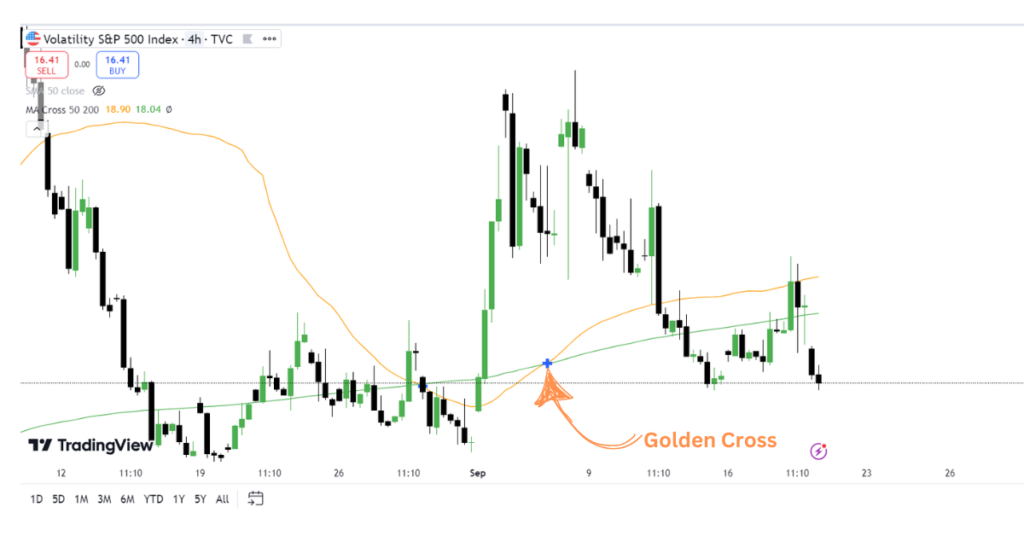
If the 50-period Moving Average (MA) crosses above the 200-period MA on a 4-hour or daily chart for the VIX 75, as illustrated in the chart above, it may signal the index is building bullish momentum. This crossover suggests a potential upward trend, indicating a favorable opportunity for long trades.
Death Cross in Volatility Index
The Death Cross happens when the short-term moving average crosses below the long-term moving average. This is considered a bearish signal, indicating that the market may enter a downtrend. In the context of VIX 75, this could signal increased volatility to the downside, meaning prices may fall, and traders should consider short positions.
Example: If the 50-period MA crosses below the 200-period MA on the VIX 75 chart, it can suggest that the index might experience a prolonged decline, offering opportunities for shorting or exiting long positions.
RSI (Relative Strength Index) for VIX 75:
The Relative Strength Index (RSI) is a momentum oscillator that measures the speed and change of price movements. It’s used to identify overbought and oversold conditions in the market, helping traders determine when to enter or exit trades in the VIX 75 Index.
Overbought Levels:
An RSI reading above 70 typically signals that the market is overbought, meaning that the price has risen too quickly and may be due for a correction or reversal. In the context of VIX 75, if the RSI crosses above 70, it suggests that the market could be overheated, and traders might consider taking profits or looking for short opportunities.
Oversold Levels:
An RSI reading below 30 indicates that the market is oversold, suggesting that the price has fallen too far, too fast, and may soon reverse or experience a price bounce. For VIX 75, if the RSI dips below 30, it could be a signal to look for buying opportunities as the market might be poised for an upward move.

Combining Moving Averages and RSI in VIX 75 Trading
When trading the Volatility 75 Index, it’s helpful to use both the Moving Averages and the RSI in combination to improve your trade entries and exits.
- For Long Trades (Buying):
- Look for a Golden Cross where the 50-period MA crosses above the 200-period MA.
- Confirm the trend by checking if the RSI is around 30 or rising, indicating the market is coming out of oversold conditions.
- For Short Trades (Selling):
- Watch for a Death Cross where the 50-period MA crosses below the 200-period MA.
- Check the RSI to see if it’s above 70 or declining, indicating the market is potentially overbought and ready for a downward move.
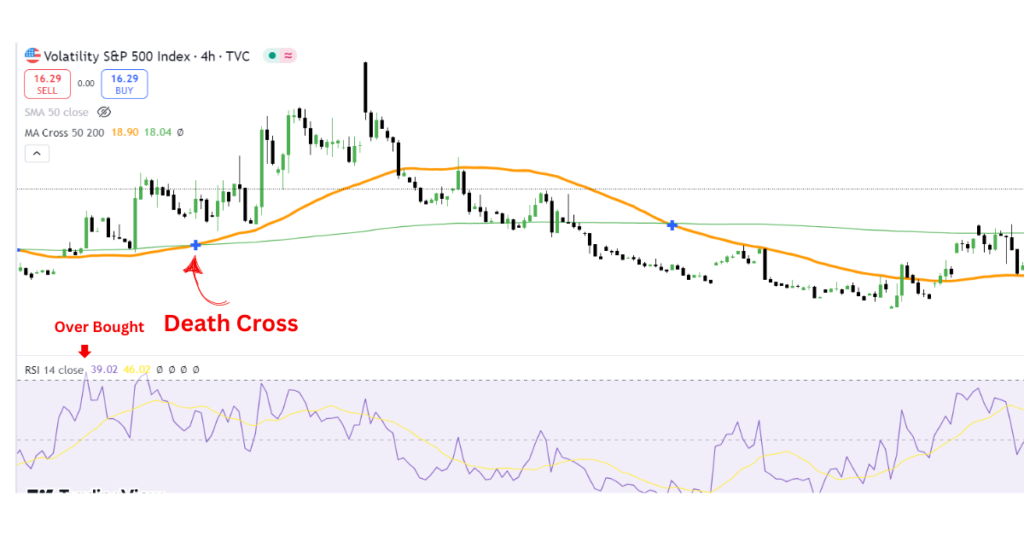
By combining these indicators, you can make more informed trading decisions on the Volatility 75 Index and better manage the risks associated with this highly volatile market.
Breakout Strategy:
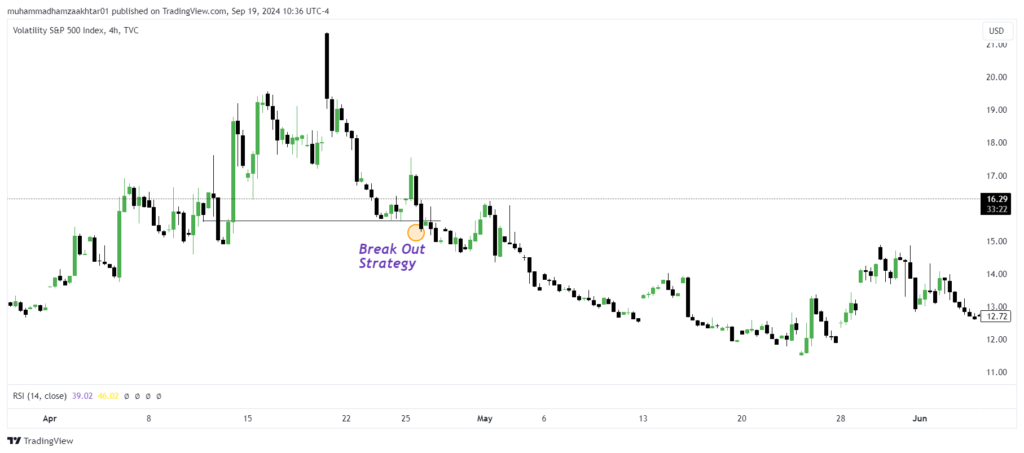
Given the high volatility, the VIX 75 often experiences price breakouts. A breakout occurs when the price moves outside of a defined support or resistance level. Capitalizing on these breakouts can offer great returns. Steps:
- Identify key support and resistance levels using technical analysis.
- Use candlestick patterns to confirm a potential breakout.
- Set tight stop losses to manage risk, as volatility can cause sharp reversals.
Scalping:
Scalping is a strategy that involves making multiple trades in a day to capture small price movements. The extreme volatility of the VIX 75 makes it ideal for scalping. However, this requires quick decision-making and precise execution. Steps:
- Use short-term charts (1 minute or 5 minutes).
- Employ indicators like the Bollinger Bands to identify potential entry points.
- Exit trades quickly to lock in small profits before the market reverses.
What are the best times to trade Volatility 75?
One of the unique features of the Volatility 75 Index is that it can be traded 24/7. This means traders can access the market at any time. However, volatility does fluctuate throughout the day, and some periods provide better trading opportunities than others.
- During High Volatility Periods:
Volatility is often highest during the beginning of market sessions when traders are reacting to the opening price. Though the VIX 75 isn’t tied to real-world markets, it mimics the sentiment-driven behavior of these markets, especially during these times. - Avoid Low Volatility Periods:
Trading during periods of low volatility might not offer significant price movements. It’s crucial to avoid these times if you’re looking for bigger market swings. Lower volatility can make range trading profitable but limits the opportunity for larger moves. - Weekend Trading:
Since the VIX 75 operates 24/7, weekend trading is possible, and this can sometimes offer good opportunities as well. However, keep in mind that liquidity might be lower on weekends, which could affect spreads and price movements.
Key Indicators for Trading VIX 75
When trading the Volatility 75 Index, technical analysis plays a pivotal role. Here are some key indicators that traders commonly use:
- Moving Averages (MA): Helps in identifying market trends. The crossover between short-term and long-term moving averages can signal potential entry and exit points.
- Relative Strength Index (RSI): Useful for determining overbought or oversold conditions. A reading above 70 suggests the market is overbought, while a reading below 30 indicates it’s oversold.
- Bollinger Bands: These bands help determine volatility by measuring the price range in which the asset moves. Bollinger Bands can also signal potential breakouts or reversals when the price touches the upper or lower bands.
- Fibonacci Retracement Levels: These levels can help identify potential support and resistance areas. They are particularly useful for determining price corrections after significant movements.
Risk Management When Trading VIX 75
Trading the Volatility 75 Index is not without its risks, especially due to its high volatility. Proper risk management is essential to avoid significant losses.
- Use Stop Losses:
Setting stop losses helps you exit trades when the market moves against you. Given the rapid price movements of the VIX 75, this is crucial for limiting your downside risk. - Leverage Wisely:
While leverage can amplify profits, it can also lead to significant losses. Use leverage cautiously and only when you are confident in your analysis and strategy. - Position Sizing:
Don’t risk too much capital on a single trade. The general rule is to risk only 1-2% of your trading capital per trade. This helps you stay in the game longer, even if some trades go against you. - Monitor Volatility Levels:
Since VIX 75 is inherently volatile, keep an eye on current volatility levels. You can use tools like the Average True Range (ATR) to measure volatility and adjust your strategy accordingly.
Conclusion
The Volatility 75 Index offers a unique and profitable trading opportunity for those who understand its nuances and are equipped with a solid strategy. From trend-following and breakout strategies to scalping and range trading, there are various ways to capitalize on the extreme volatility that the VIX 75 provides.
By using the right technical indicators and employing sound risk management techniques, you can enhance your chances of success. Whether you’re an experienced trader or just getting started, mastering the Volatility 75 Index trading strategy can provide a pathway to significant profits in the financial markets.

