What is the ICT New Week Opening Gap (NWOG)?
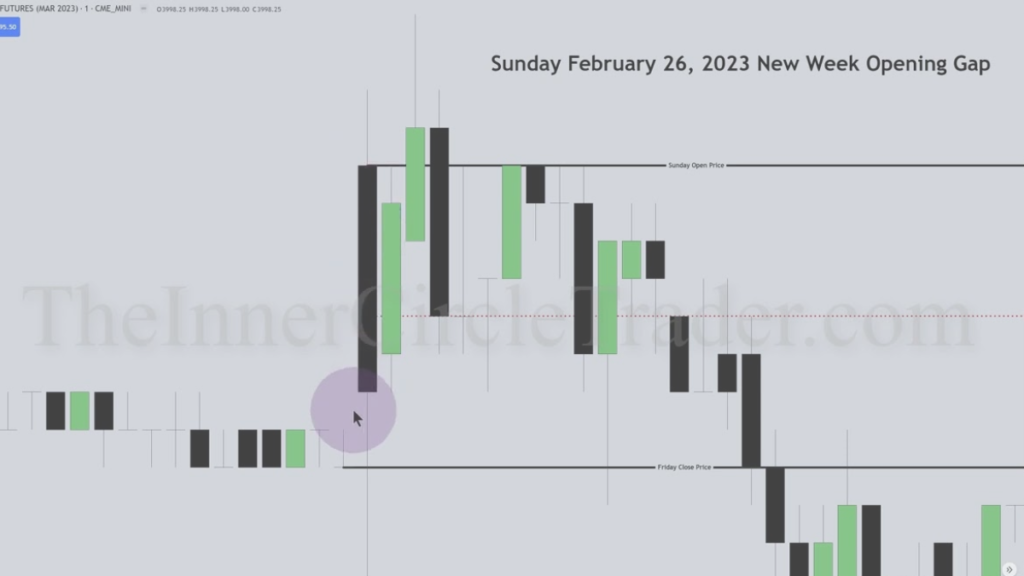
The ICT New Week Opening Gap (NWOG) is the difference between the closing price of a stock or asset on Friday and its opening price on Sunday. This gap happens because there’s no trading over the weekend, which can lead to changes in price due to new information or events that occur when the markets are closed.
How to Identify an ICT NWOG
- Mark Friday’s Closing Price: Note the price of the asset at 03:59 PM EST on Friday.
- Mark Sunday’s Opening Price: Note the price when the market opens at 06:00 PM EST on Sunday.
The difference between these two prices is the NWOG. This gap is also known as a liquidity void because no trading happens over the weekend, creating a gap in the price.
Why NWOG Matters
The NWOG often acts like a magnet for price movements. Prices tend to move back toward this gap to “fill” it, seeking a fair value. This means that the NWOG can be a crucial level to watch in trading.
How to Use NWOG in Your Trading
- Mark the NWOG on a Weekly Chart: Identify the NWOG on a weekly chart to understand its significance.
- Analyze Lower Time Frames: Switch to smaller time frames, like 15-minute charts, for detailed trading signals.
Key Concept: Consequent Encroachment
The 50% level of the NWOG is called the consequent encroachment. This level is important because it can act as a strong support or resistance. Here’s how to find it:
- Use the Fibonacci Tool: Apply a Fibonacci retracement tool with levels 0, 0.5, and 1.
- Measure the NWOG: Place the tool from the low to high of the NWOG. The 50% level is often where significant price reactions occur.
Why Does the NWOG Happen?
Since markets are closed over the weekend, no trades occur. If important news or events happen during this time, the opening price on Sunday might be significantly different from Friday’s closing price. This creates the NWOG.
How to Trade Based on NWOG
- Bullish Bias:
- Price Above NWOG: If the price is above the NWOG, wait for it to pull back and test the gap. Look for confirmation, like a Market Structure Shift on a 5 or 15-minute chart, before buying. Aim for the next liquidity target.
- Price Below NWOG: If the price is below the NWOG and you’re bullish, expect it to test and move above the gap. Once it closes above the NWOG, it can act as support.
- Bearish Bias:
- Price Below NWOG: If the price is below the NWOG, wait for it to pull back and test the gap. Look for a bearish Market Structure Shift on a lower time frame before selling. Target the next liquidity draw.
- Price Above NWOG: If the price is above the NWOG and you’re bearish, expect it to test and move below the gap. Once it closes below the NWOG, it can act as resistance.
Why Track Multiple NWOGs?
Tracking several NWOGs on your chart helps you:
- Understand Market Context: Multiple NWOGs provide a clearer picture of the market’s fair value over time.
- Identify Key Levels: They offer important support and resistance levels, which are useful for making better trading decisions.
By keeping an eye on NWOGs, you can better predict price movements and make more informed trades.

