In this we’ll explore ICT Market Order Flow and how it can help improve your trading results. We’ll cover what it is, how to identify it, and how to use it with real market examples.
What is ICT Market Order Flow?
ICT Market Order Flow involves tracking the movement of orders from traders, investors, and institutions. These movements influence currency prices.
A key concept related to this is the ICT Order Block, which is a type of order flow. In simple terms, order flow consists of candlesticks that move against the main trend of the market.
What Does ICT Market Order Flow Show Us?
Order flow provides insights into the activities of smart money. When the price pulls back after a rally, smart money begins building positions. Because these large orders can’t be completed in one go, the pullback candlesticks are considered order flow.
How to Identify ICT Order Flow
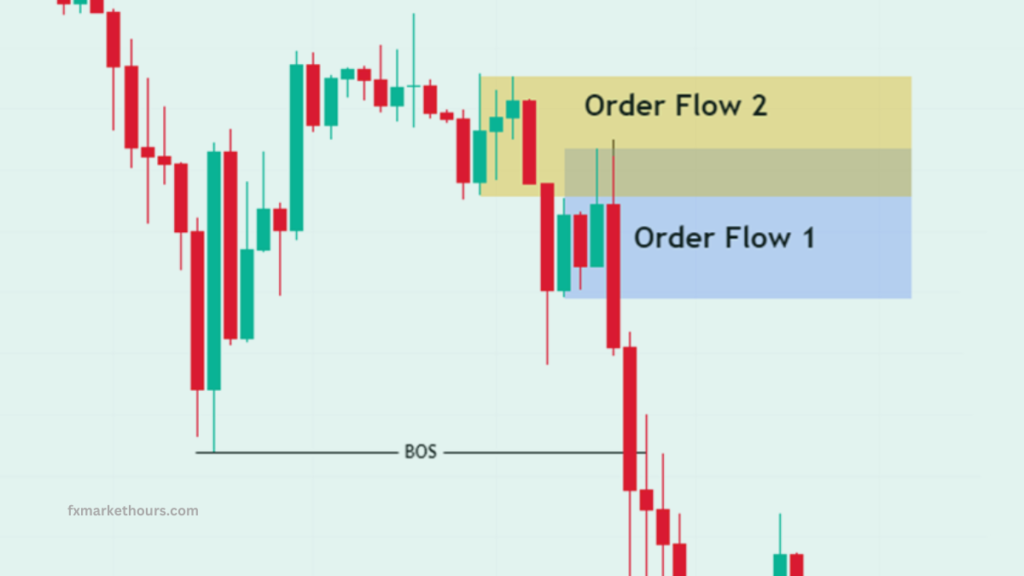
To spot ICT Order Flow, you need to understand Break of Structure (BOS). Order flow consists of pullback candlesticks that occur before a BOS.
- Bullish ICT Order Flow: These are bearish candlesticks that form during a bullish trend before a BOS happens. They act as support levels where traders might buy.
- Single Candle Pullback: If there’s just one bearish candlestick, mark it as order flow.
- Multiple Candlesticks: If several bearish candlesticks appear, mark the whole area as an order flow zone.
Trading Bullish Order Flow:
- Mark the order flows below the BOS level.
- Wait for the price to retrace and test the order flow.
- Look for bullish signs, like ICT Market Structure Shift, on a lower time frame.
- If you see bullish evidence, consider buying. Place your stop loss below the order flow low and target the previous high or the next liquidity draw for your take profit.
- Bearish ICT Order Flow: These are bullish candlesticks that form during a bearish trend before a BOS. They act as resistance levels where traders might sell.
- Single Candle Pullback: Mark a single bullish candlestick as order flow.
- Multiple Candlesticks: Mark all of them as an order flow zone.
Trading Bearish Order Flow:
- Mark the order flows above the BOS level.
- Wait for the price to retrace and test the order flow.
- Look for bearish signs, like ICT Market Structure Shift, on a lower time frame.
- If you see bearish evidence, consider selling. Place your stop loss above the order flow high and target the previous low or the next liquidity draw for your take profit.
Real Market Examples
Bullish Order Flow Example:
(Include example chart or diagram)
Bearish Order Flow Example:
(Include example chart or diagram)
This guide on ICT Market Order Flow Explained in Depth helps you understand how to track and use order flow to make better trading decisions. For more details, you can download the full PDF or view charts illustrating these concepts.

